
 Market Analysis
Understanding market trends
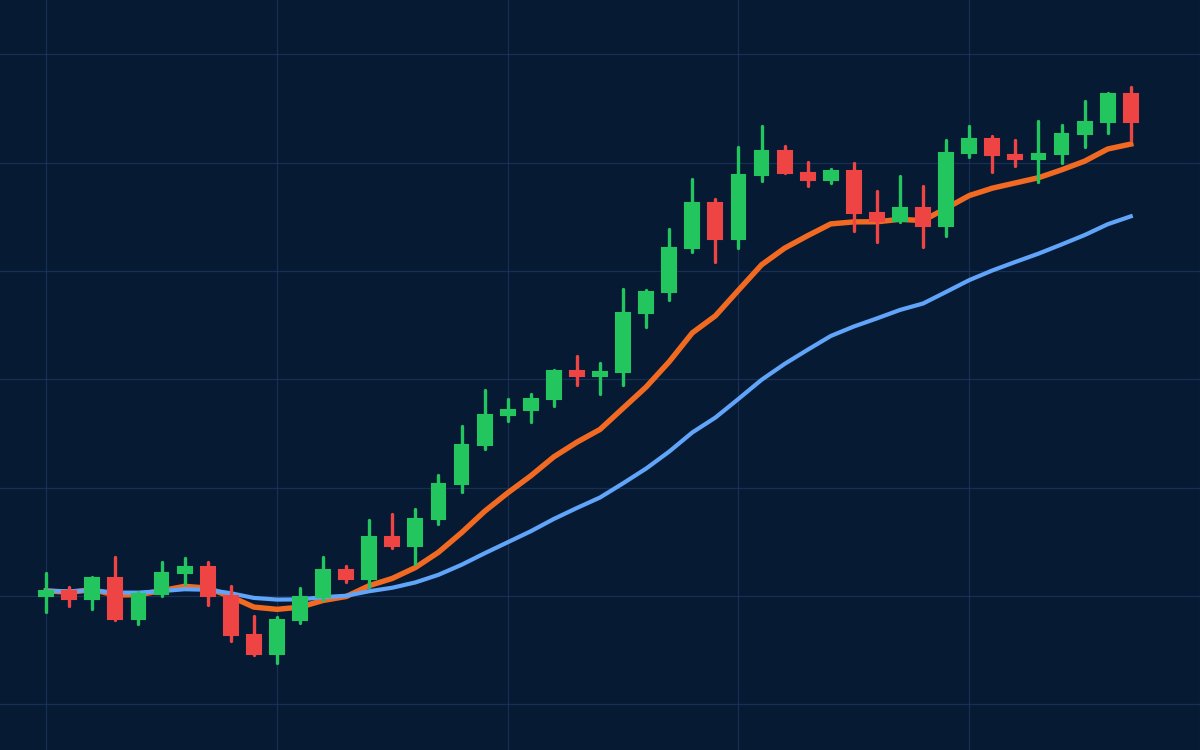
Higher highs, higher lows and how moving averages help you stay on the right side of the trend.
Read articleMarket AnalysisHigher highs, higher lows and how moving averages help you stay on the right side of the trend.
Read article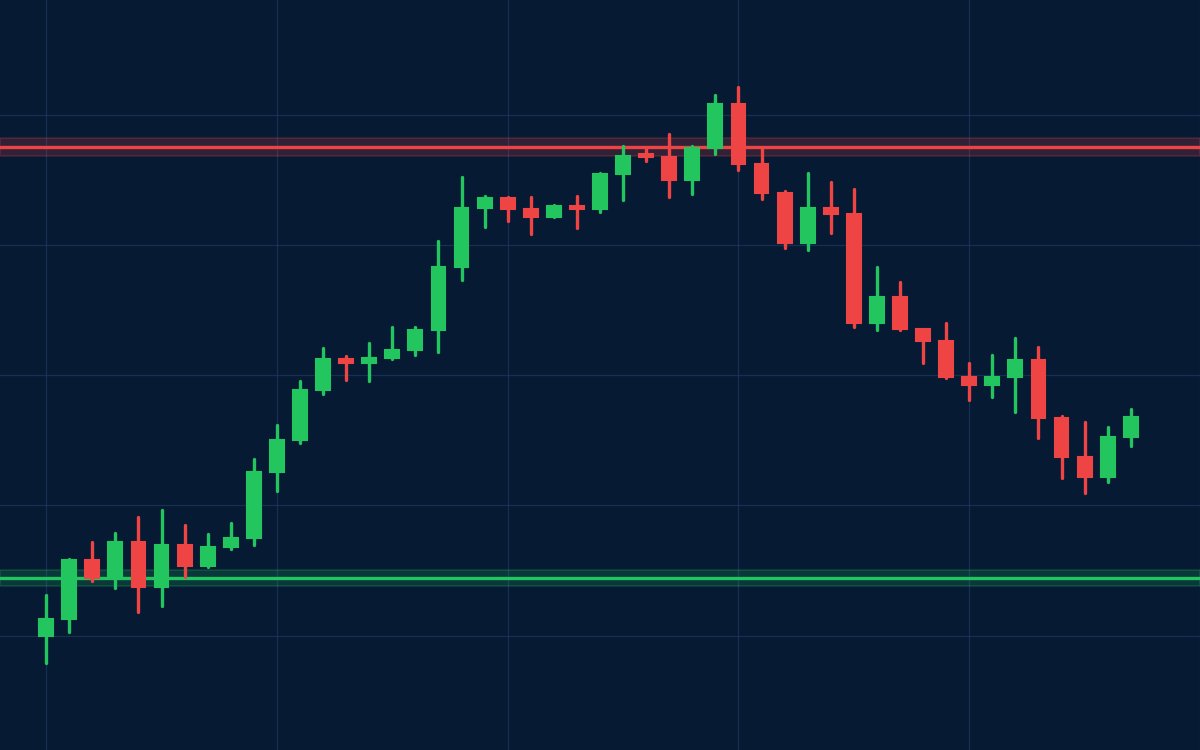 Price Action
Why price reacts at certain levels and how to use those zones to plan entries and exits.
Read article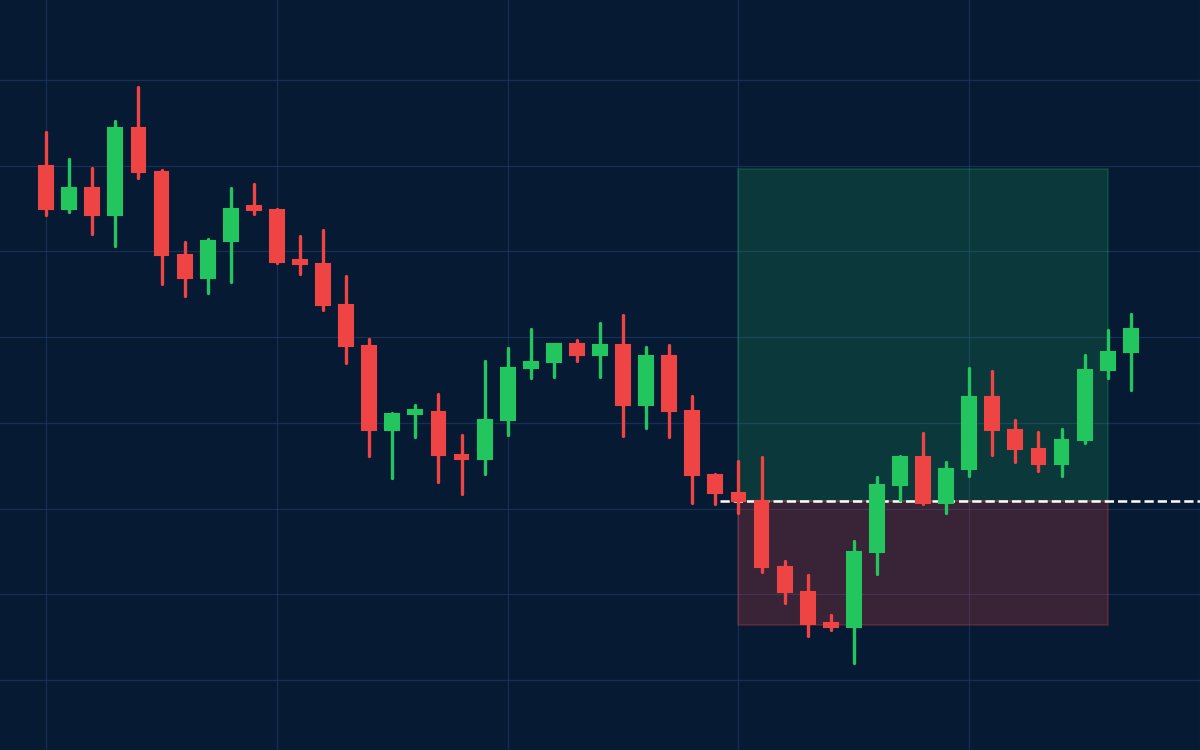 Risk Management
Setting a stop-loss and target before entry, and sizing positions so losses stay small.
Read articleA trend is simply the direction the market is moving over a period of time. Before taking any trade, the first question to ask is: is the market trending up, trending down, or moving sideways?
Moving averages smooth out price so the direction is easier to see. A common approach is to watch a faster average (such as a 9 or 20 EMA) relative to a slower one (such as a 21 or 50 EMA). When the faster average stays above the slower one and both slope upward, the trend is generally up.
Trading in the direction of the trend usually gives trades more room to work. Fighting a strong trend is one of the most common mistakes beginners make. In our live sessions we identify the trend first — every day — before looking for any entry.
Support is an area where buying interest has previously stopped price from falling further. Resistance is an area where selling has previously stopped price from rising.
Price rarely turns at an exact number. Mark support and resistance as zones around previous swing highs and lows, and look for areas where price has reacted more than once.
When resistance breaks convincingly, it often acts as support on a retest — and vice versa. Watching these retests in real time is one of the most practical skills we practise in Live Trade Daily.
Every trade has two possible outcomes. Before entering, a disciplined trader already knows how much they could lose and what they are aiming to gain.
If you risk ₹1 to potentially make ₹2, your risk–reward is 1:2. With a favourable ratio, you do not need to win every trade to stay on track — but no ratio guarantees results.
Decide the maximum you are willing to lose on one trade (many traders keep this to a small percentage of their capital), then size the position so that hitting the stop-loss costs no more than that amount.
Each candlestick shows four prices for a period: the open, high, low and close. The body shows the open-to-close range and the wicks show how far price travelled beyond it.
Patterns such as the hammer, engulfing candle or doji are more meaningful when they appear at an important support or resistance zone and in line with the trend. On their own, in the middle of nowhere, they mean much less.
A breakout happens when price moves decisively through a support or resistance zone. Breakouts can start strong moves — but many fail and quickly reverse. These are called false breakouts.
Instead of chasing the first candle, many traders wait for a retest of the broken level and enter only if it holds. This often gives a clearer stop-loss and a better risk–reward.
Memory is selective — we remember big wins and forget the small mistakes that repeat. A trading journal gives you an honest record of what you actually did.
Once a week, look for patterns: which setups work best for you, which mistakes repeat, and which times of day you trade well. Small improvements here add up over time. We close every live session with a review for exactly this reason.